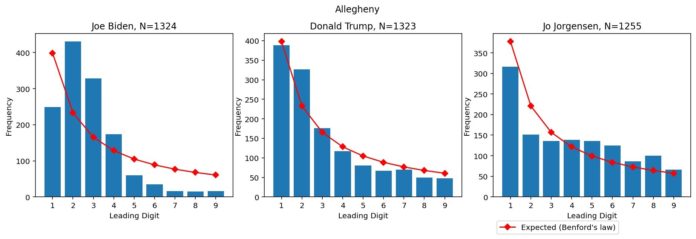
In the 2020 Election, results from Benford Analysis were quickly taken down and censored on social media because they indicated massive Democrat fraud. This same technique is now being used in Brazi to identify areas of voter fraud in the recent corrupt election there.
In 2020, The Gateway Pundit reported on numerous cities where Benford analysis identified that the results for Joe Biden were likely fraudulent and certain areas for investigation. The results in Pittsburg (note above for Allegheny County), Chicago, and Milwaukee showed clear evidence that investigations should have been performed in those areas.
Because these results clearly showed some sort of election fraud going on, the bosses at Twitter took down these tweets and censored us. They also censored anyone who shared these results. These results were accurate and indicated massive fraud. This is why they were censored by Big Tech.
This same methodology is now being used by those looking into the stolen election in Brazil.
CD Media shares:
Following up on the first round analysis applying Newcomb-Benford’s Law that we were given by a source representing a group of international experts in political science, mathematics, elections, accounting fraud, and forensic analysis- our technical expert(s) source provided a just completed new document presenting statistical findings on the Second Round of Brazilian elections, which occurred on October 30, 2022.
The source applied Benford’s Law, a highly recognized statistical formula, to analyze publicly available data provided by the Brazilian Electoral Court (TSE). All the data was culled straight from the public site which has always been the repository for these results- both historical data and new data in real time as ballots get tabulated and vote counts published.
The formula, which is used to demonstrate inconsistencies in data sets and raise red flags that suggest an audit should be undertaken to gauge if fraud actually did occur. This study does suggest inconsistencies in the voting tabulation in several regions across the country. According to the source team, in the second round analysis they have observed MORE illogical numerical distributions than in the first round data.
This same methodology should be used in all the House Seats and Senate Seats across the country. We probably wouldn’t be surprised by what we find.


